R SaMPLE
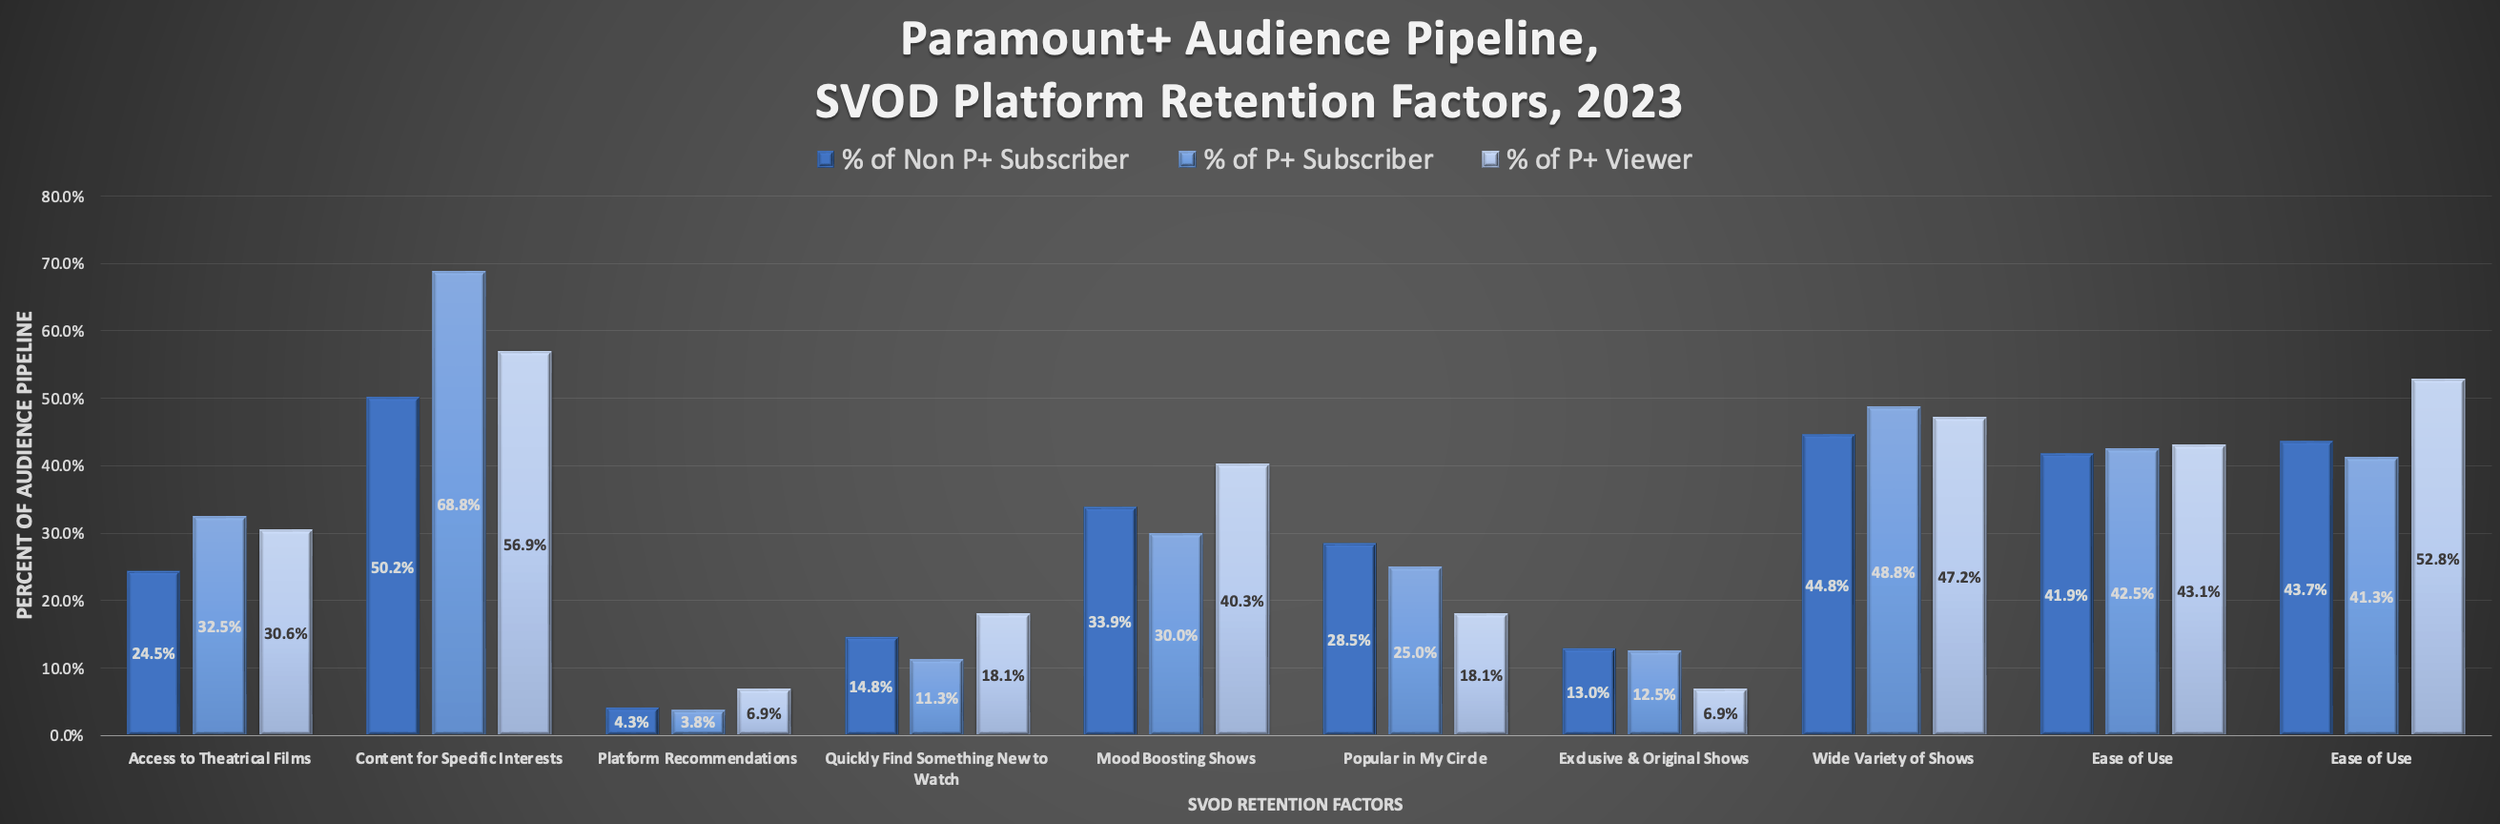
In this final project from my Programming for R Analytics course, I explore a data set from study: “Child Care and Children with Special Needs: Challenges for Low Income Families, Maine, US, 2002-2005.”
With some small data transformation/manipulation to make some of the variables more accessible for analysis, and some baseline exploration, I attempt to unpack the relationship between school attendance and care quality, household structure and work disruption rates, and income to disruption rate.
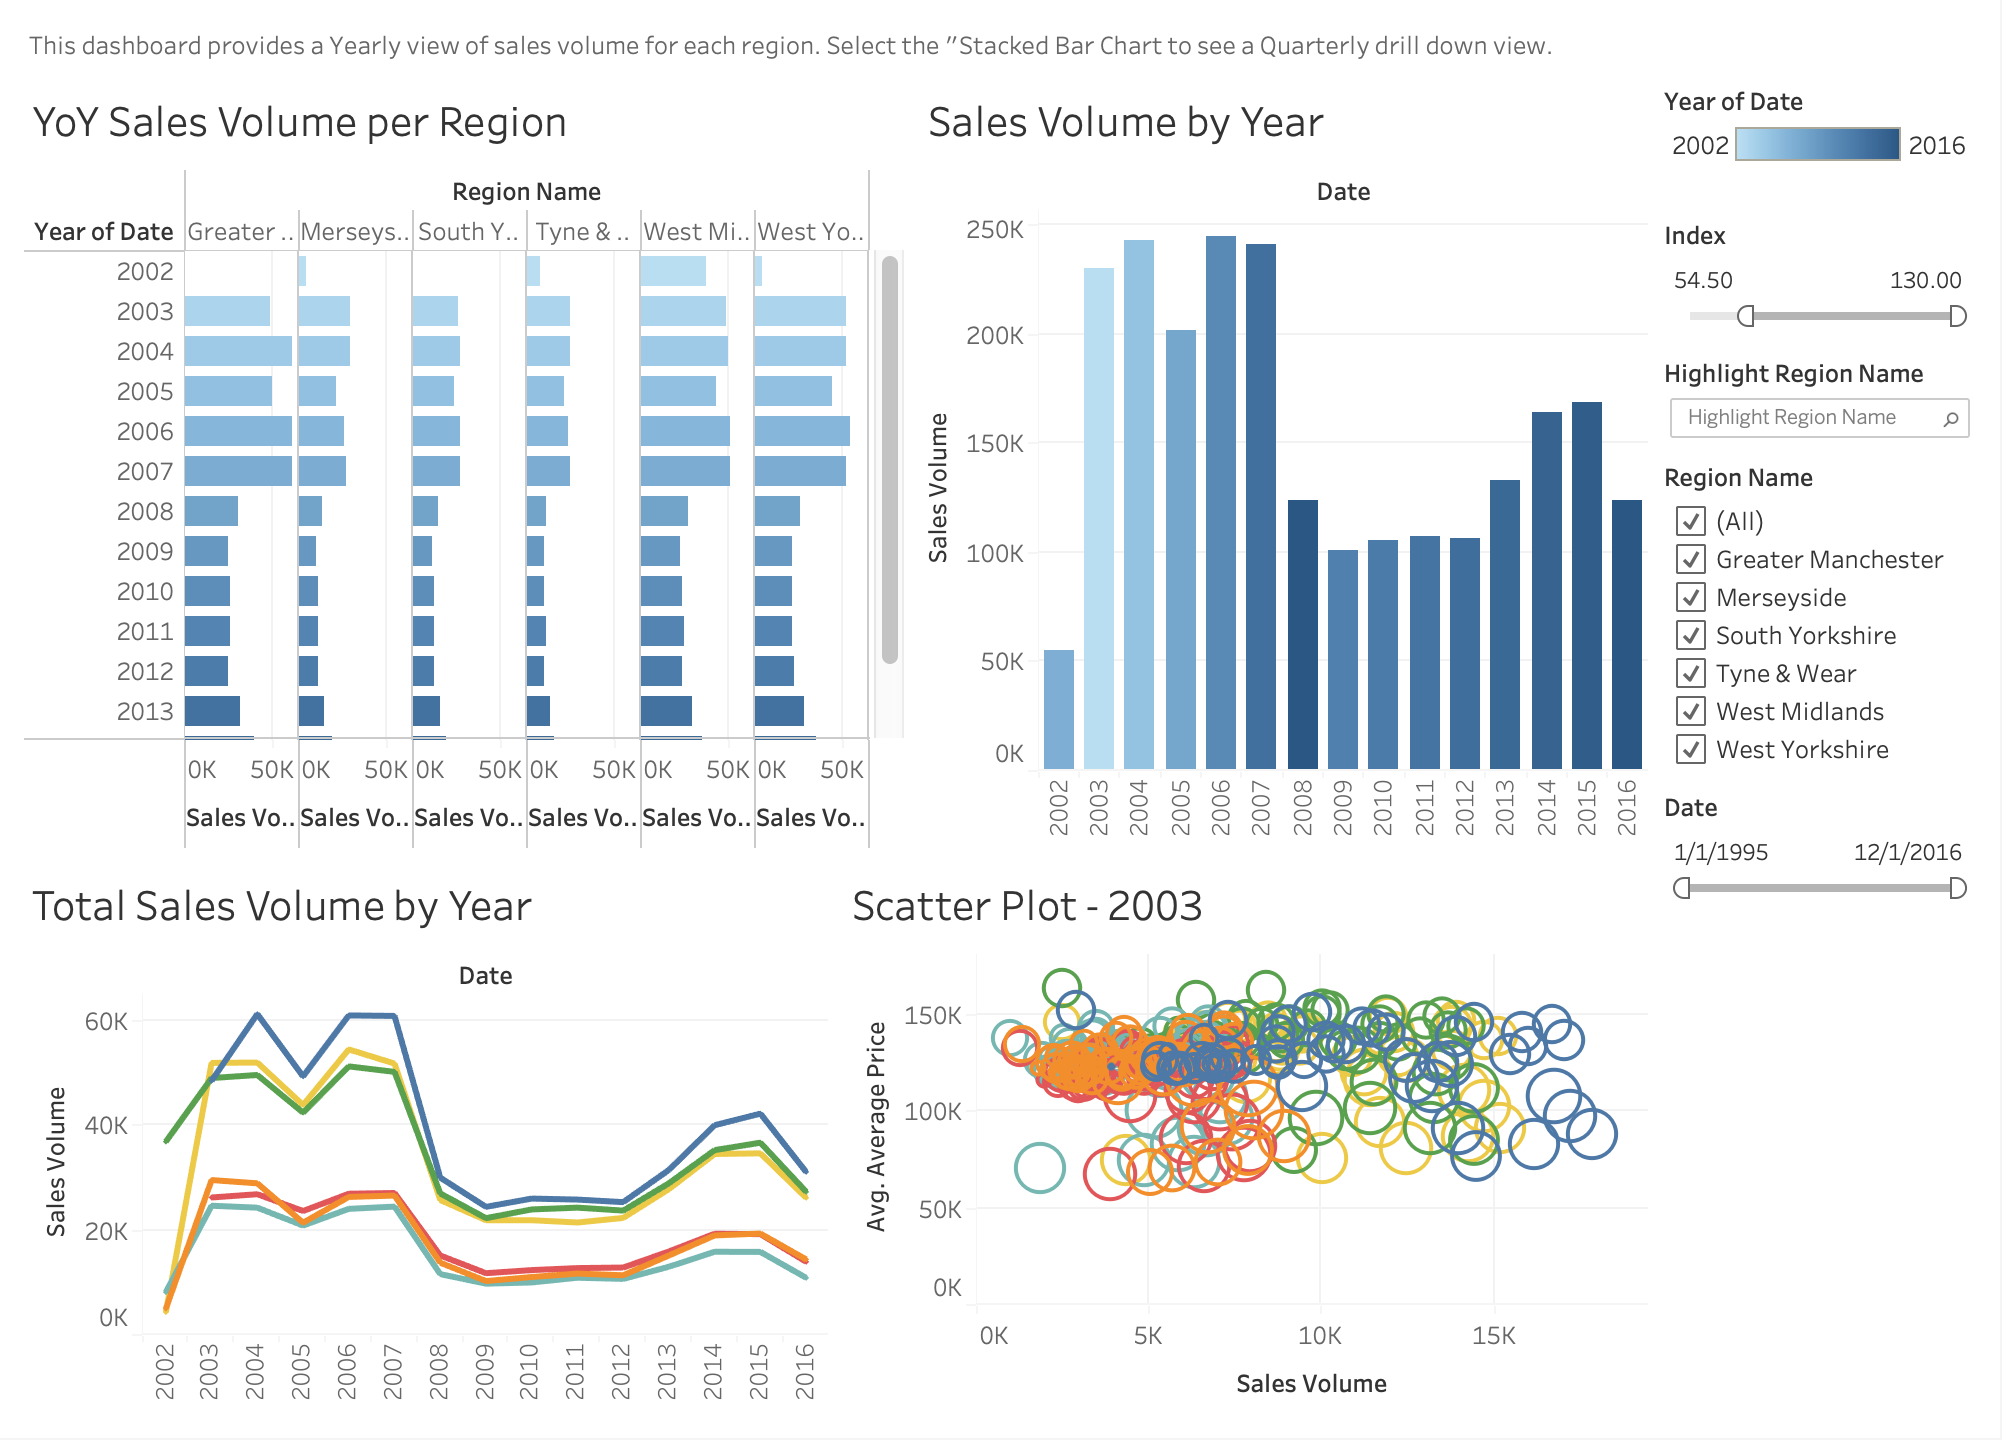
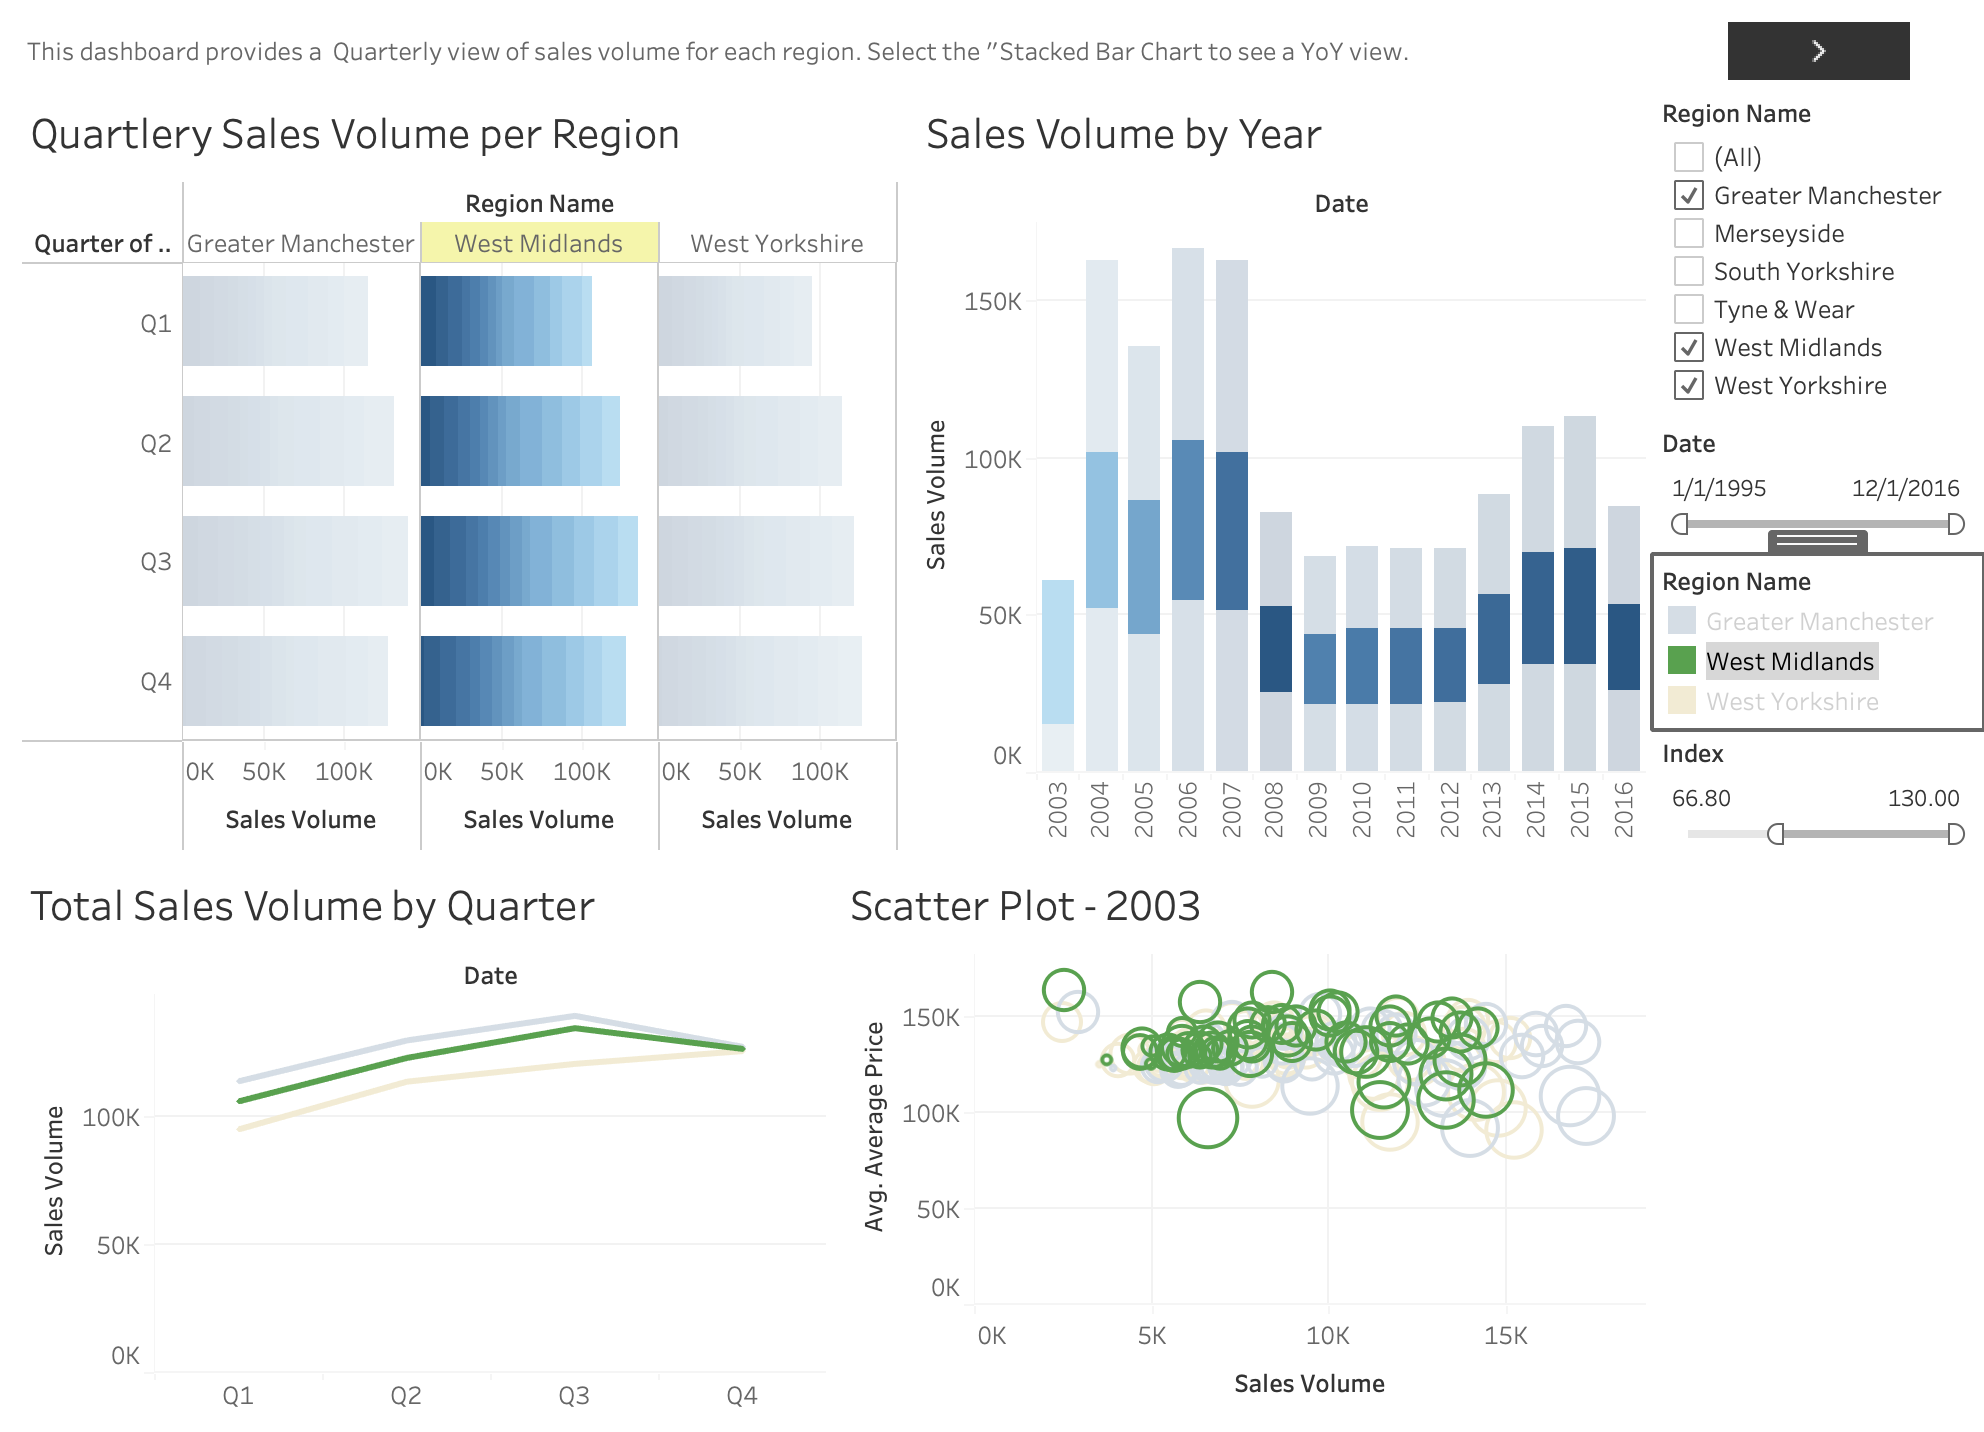
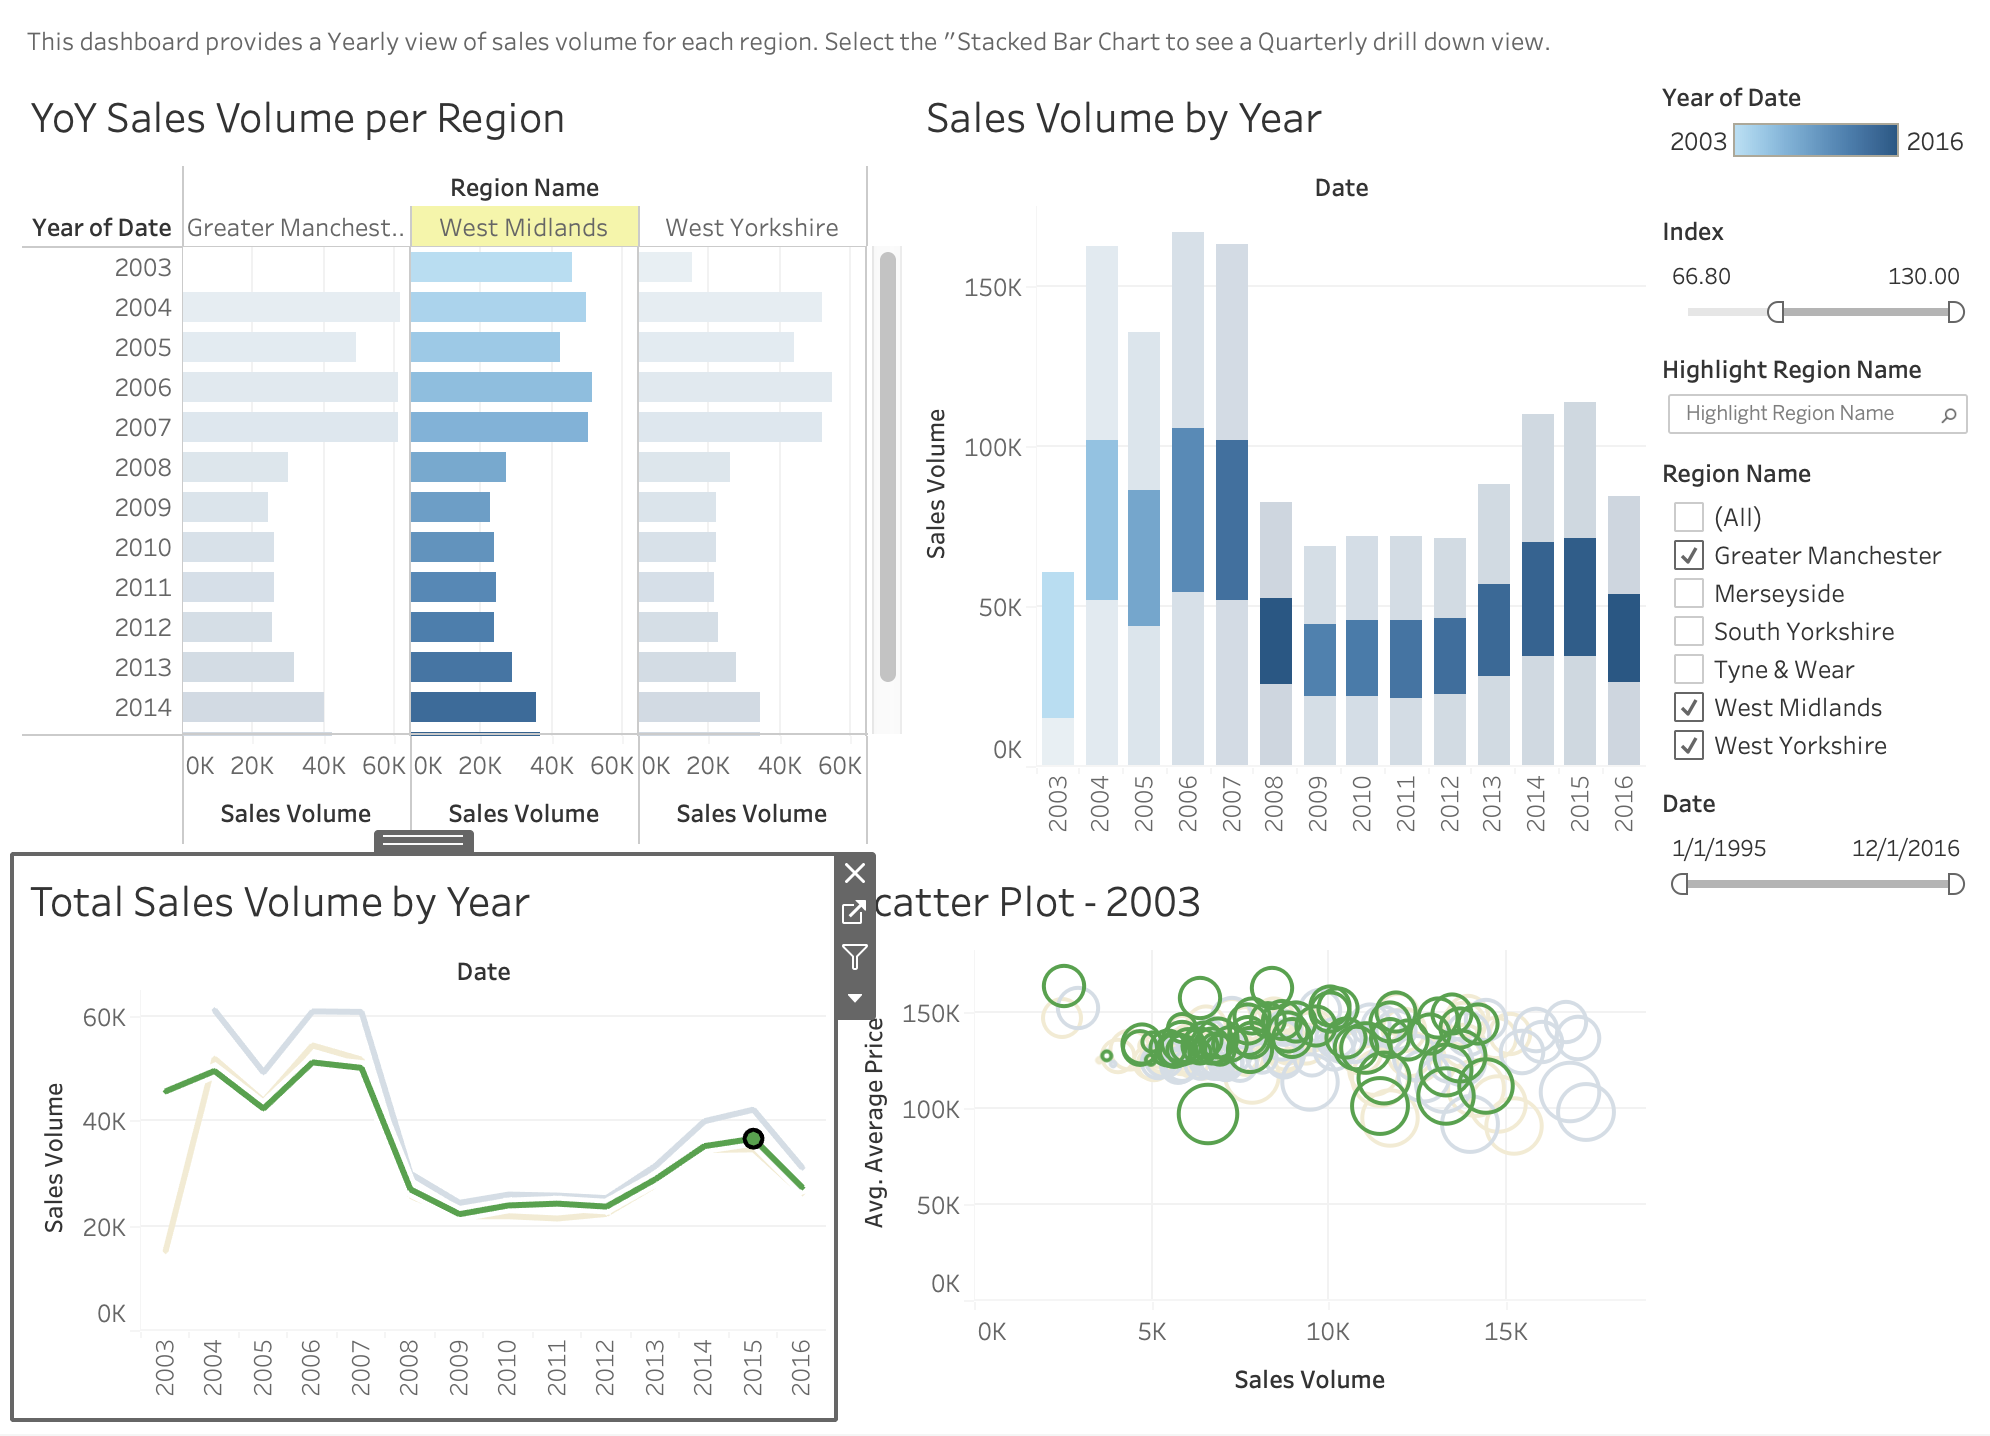
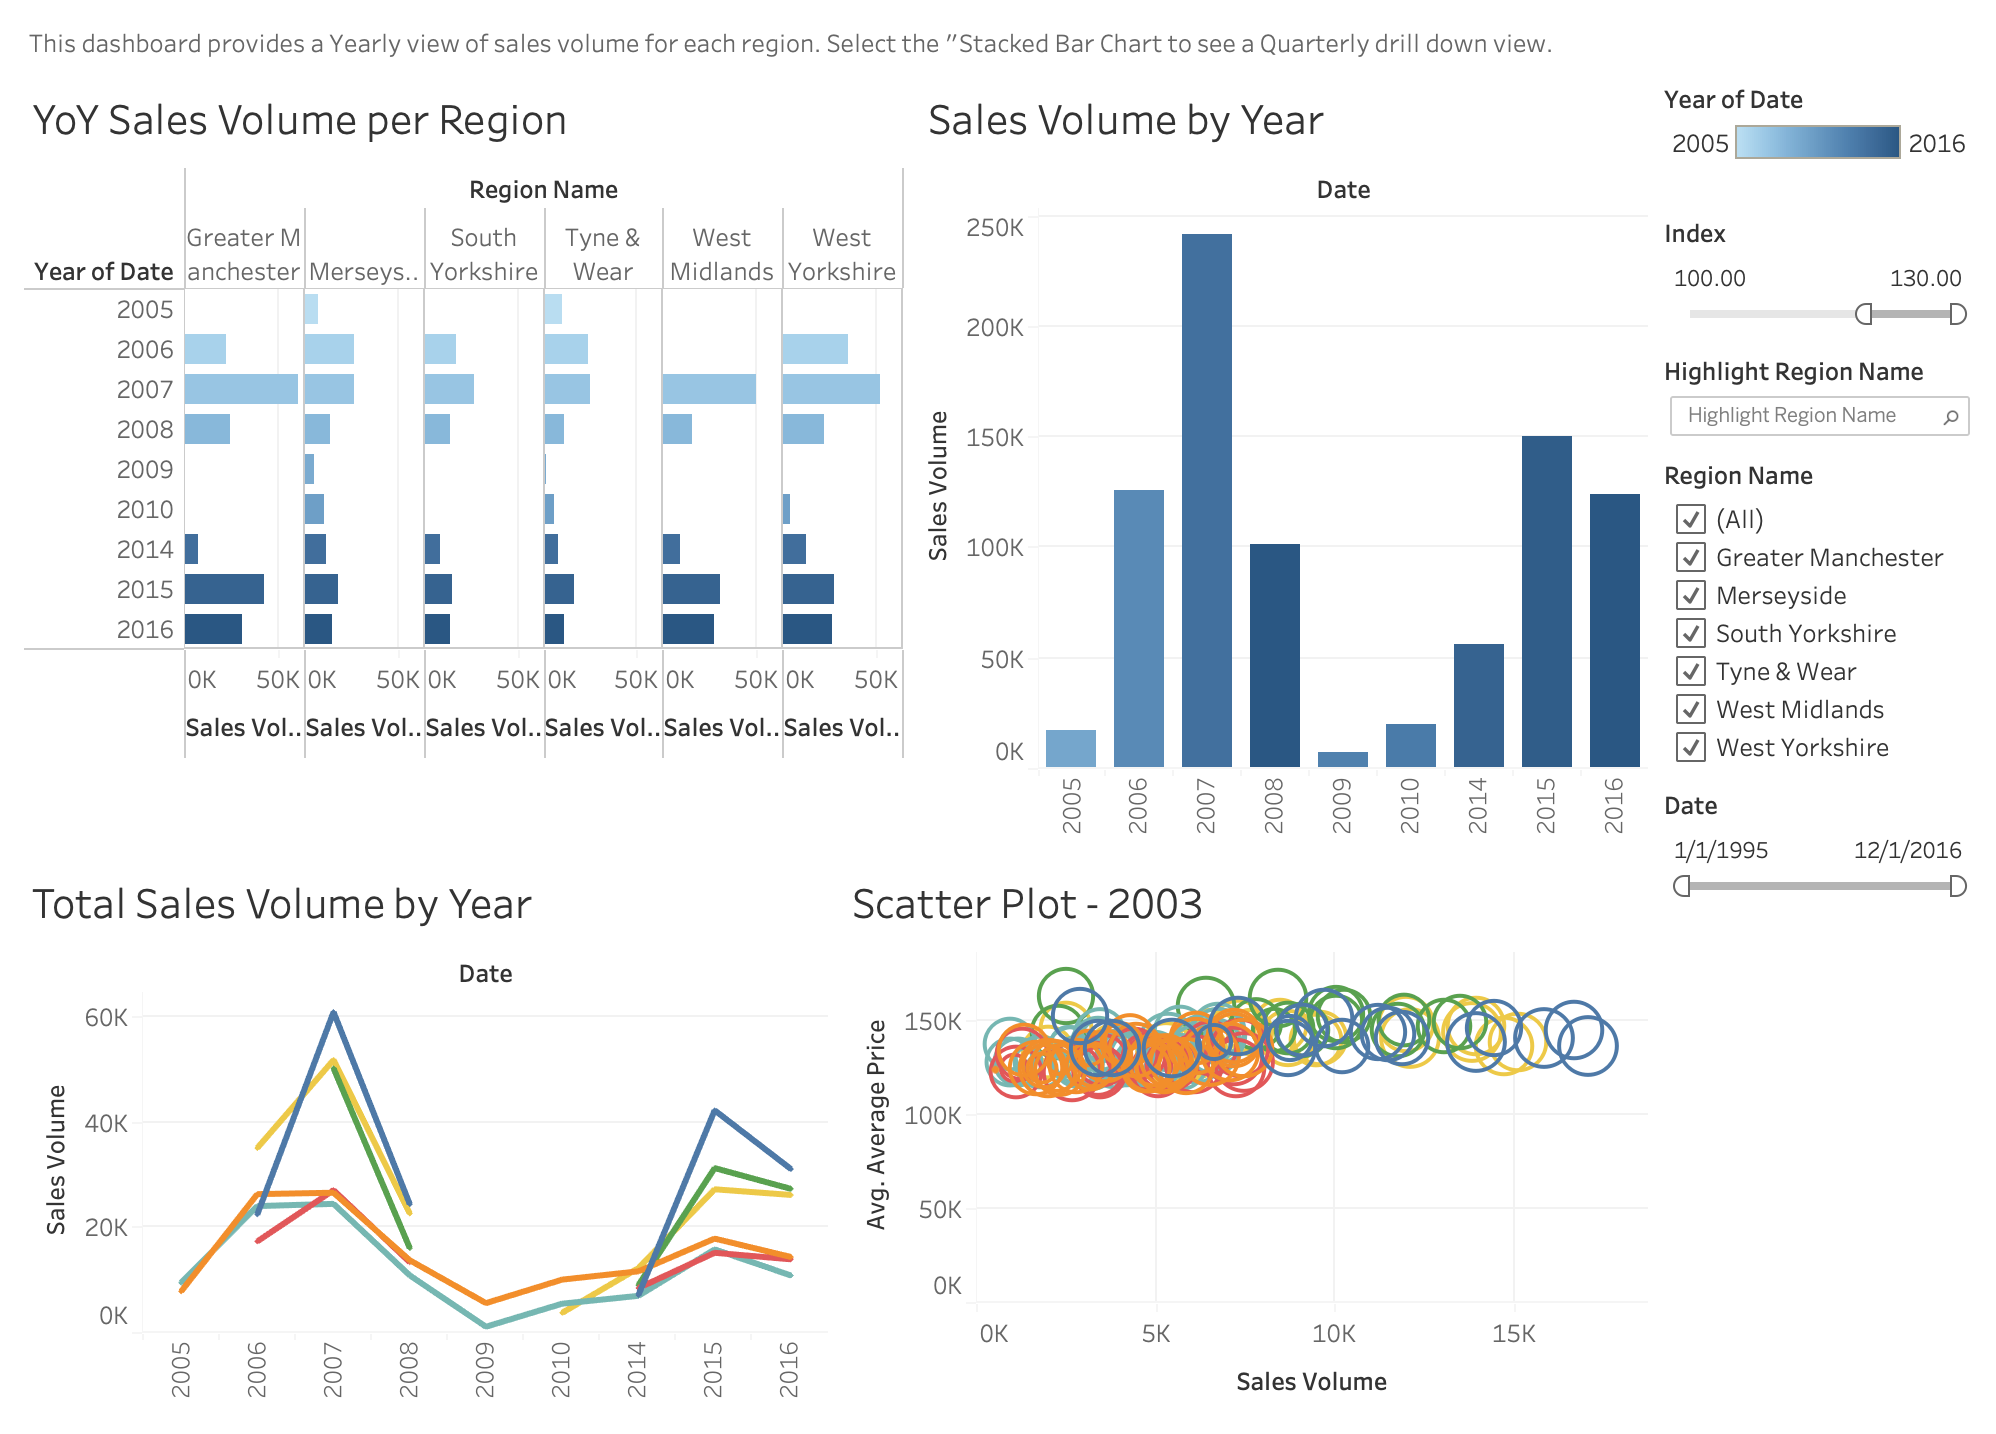
Tableau Sample
Using fabricated company data, I build a Yearly to Quarterly drill down dashboard tracking total sales volume for each sales region. Sizing, Color, and interactive filters were used to create. Completed courses from Carnegie Mellon & Udemy to support learning of this tool.
SQL QUERYING
Please feel free to ask me to complete a set of querying to explore a data set and provide insights.
EXCEL
Knowledgeable in cleaning, formatting, transforming, and integrating new data from various sources. I enjoy building logic in interlinking cells to automate needed data entry, and building macros. Able to build Pivot Tables and Pivot Charts. Familiar with pulling consumer survey information and adapting raw data into insights.